


Spotting profitable chart patterns involves recognizing specific shapes in price movements. These patterns can guide traders to make informed decisions without losing capital.
Understanding chart patterns is crucial for successful trading. Traders use these patterns to predict market movements and make profitable trades. Common patterns include head and shoulders, double tops, and triangles. Each pattern offers insights into potential price direction and market sentiment.
By learning to identify these patterns, traders can enhance their strategies and minimize risks. Consistent practice and analysis help in mastering this skill. Remember, staying informed and disciplined is key to trading success. Use chart patterns as a tool, not a guarantee, for better trading outcomes.
Introduction To Chart Patterns
Chart patterns are important in trading. They help traders make smart decisions. Understanding these patterns can improve your trading skills. This guide covers the basics of chart patterns.
What Are Chart Patterns?
Chart patterns are shapes on a price chart. They form due to price movements. Traders use them to predict future price directions. There are many types of chart patterns.
- Head and Shoulders
- Triangles
- Double Tops and Bottoms
- Flags and Pennants
Importance In Trading
Chart patterns are crucial for trading. They help identify potential buy or sell points. Recognizing these patterns can prevent capital loss. Traders can make informed decisions using them.
Here are some key points:
- Identify Trends: Patterns show market trends.
- Risk Management: They help manage trading risks.
- Profitability: Good patterns can lead to profitable trades.
| Pattern Type | Signal |
|---|---|
| Head and Shoulders | Reversal |
| Triangles | Continuation |
| Double Tops and Bottoms | Reversal |
| Flags and Pennants | Continuation |
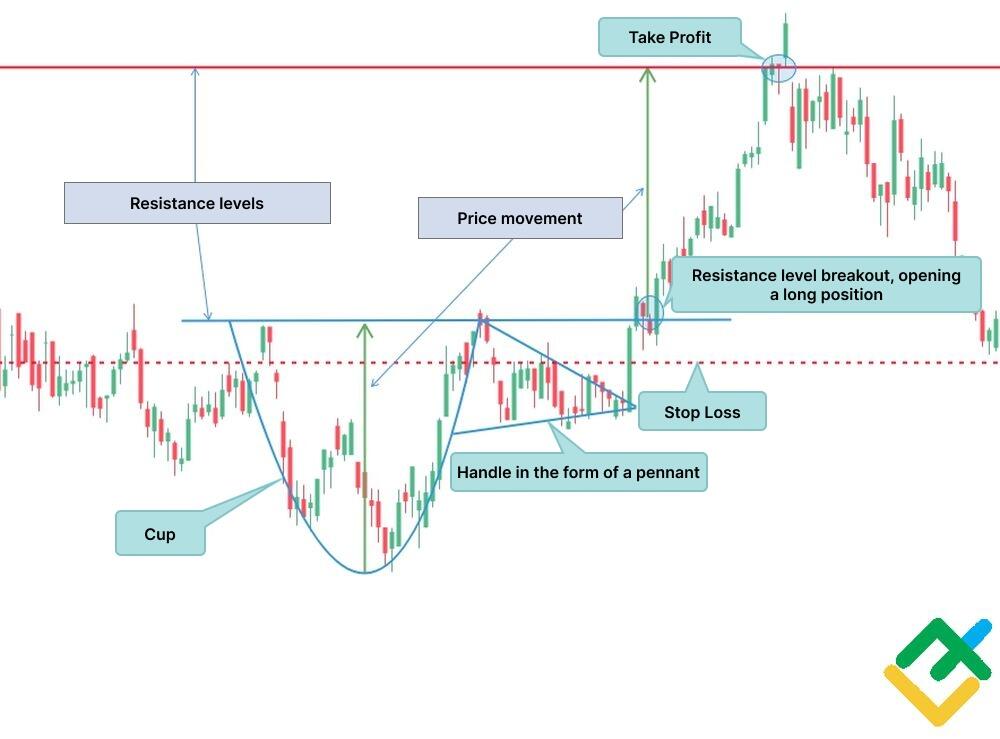
Credit: www.litefinance.org
Basic Types Of Chart Patterns
Learning to spot profitable chart patterns is essential for trading success. Understanding the basic types of chart patterns helps you make trades with confidence. There are two primary types: Reversal Patterns and Continuation Patterns.
Reversal Patterns
Reversal patterns indicate that the current trend is about to change. Traders use these patterns to anticipate market shifts. Here are some common reversal patterns:
- Head and Shoulders: This pattern signals a trend reversal.
- Double Top: Two peaks at the same level indicate a reversal.
- Double Bottom: Two bottoms at the same level signal a trend change.
- Triple Top: Three peaks at the same level suggest a reversal.
- Triple Bottom: Three bottoms at the same level indicate a trend shift.
Continuation Patterns
Continuation patterns suggest that the current trend will continue. These patterns help traders identify opportunities to stay in a trade. Here are some common continuation patterns:
- Triangles: This includes ascending, descending, and symmetrical triangles.
- Flags: A small rectangle pattern indicating a brief pause.
- Pennants: Similar to flags but with converging trend lines.
- Rectangles: A range-bound pattern showing consolidation.
Understanding these basic chart patterns helps you make informed trading decisions. Spotting these patterns can protect your capital and increase your profits.
Identifying Key Patterns
Trading stocks requires understanding and spotting profitable chart patterns. These patterns help you make informed trades without losing your capital. Learn how to identify key patterns to increase your chances of success.
Head And Shoulders
The Head and Shoulders pattern is a popular chart pattern. It indicates a potential reversal in the market trend. This pattern consists of three peaks:
- The first peak is the left shoulder.
- The second peak is the head, which is the highest peak.
- The third peak is the right shoulder.
Traders watch for this pattern to predict a market downturn. Spotting this pattern early can help you avoid losses and make profitable trades.
Double Tops And Bottoms
Double Tops and Bottoms are also key patterns in trading. They signal trend reversals and are easy to spot. A Double Top looks like the letter "M". It forms after a sustained uptrend and indicates a bearish reversal. A Double Bottom resembles the letter "W". It forms after a downtrend and signals a bullish reversal.
To spot these patterns, look for the following:
- Two distinct peaks or valleys at roughly the same level.
- A noticeable decline or rise between the peaks or valleys.
Recognizing these patterns can help you make trades with confidence. It reduces the risk of losing your capital.
| Pattern | Formation | Indication |
|---|---|---|
| Head and Shoulders | Three peaks: Left shoulder, head, right shoulder | Market downturn |
| Double Top | Two peaks forming an "M" shape | Bearish reversal |
| Double Bottom | Two valleys forming a "W" shape | Bullish reversal |
Advanced Chart Patterns
Learning advanced chart patterns helps traders to make better decisions. These patterns offer insights into market trends. Knowing them can increase your chances of success.
Triangles
Triangles are popular chart patterns. They show periods of consolidation before a breakout. There are three main types:
- Ascending Triangles: This pattern has a flat top and a rising bottom. It indicates that buyers are gaining strength.
- Descending Triangles: This pattern has a flat bottom and a falling top. It shows that sellers are becoming stronger.
- Symmetrical Triangles: This pattern has converging trend lines. It suggests that a breakout can happen in either direction.
| Triangle Type | Indication |
|---|---|
| Ascending | Buyers gaining strength |
| Descending | Sellers becoming stronger |
| Symmetrical | Breakout in either direction |
Flags And Pennants
Flags and Pennants are short-term continuation patterns. They indicate a brief pause before the trend resumes. They are easy to spot and trade.
Here are their key features:
- Flags: These look like small rectangles. They form after a sharp price movement. The price then moves sideways.
- Pennants: These resemble small symmetrical triangles. They form after a significant price move. The price consolidates in a converging pattern.
Both patterns suggest that the price will continue in the same direction after the consolidation.
Tools For Spotting Patterns
Trading successfully requires spotting profitable chart patterns. Using the right tools can help you identify these patterns and make trades without losing your capital. Below, we explore various tools that can assist you in spotting these patterns effectively.
Technical Indicators
Technical indicators are mathematical calculations based on historical price, volume, or open interest. These indicators help traders predict future price movements.
- Moving Averages: These indicators smooth out price data to create a single flowing line. This line can show the general direction of the market.
- Relative Strength Index (RSI): RSI measures the speed and change of price movements. It helps identify overbought or oversold conditions.
- MACD (Moving Average Convergence Divergence): This indicator shows the relationship between two moving averages. It helps identify changes in the strength, direction, momentum, and duration of a trend.
Software And Apps
Many software and apps are designed to help traders identify profitable chart patterns. These tools can save time and improve accuracy.
| Tool | Description |
|---|---|
| MetaTrader 4 | This is a popular trading platform. It offers advanced charting tools and technical analysis. |
| TradingView | TradingView provides real-time charts and various technical indicators. It also offers a social network for traders. |
| Thinkorswim | This platform from TD Ameritrade offers advanced charting and analysis tools. It is suitable for both beginners and advanced traders. |
Using the right technical indicators and software can significantly improve your trading success. By identifying profitable chart patterns, you can make trades without risking your capital.
:max_bytes(150000):strip_icc()/Daytradingretail-4580652-V1-07aafc440cce43889f20ef84c5180e7b.png)
Credit: www.investopedia.com
Risk Management Strategies
Understanding Risk Management Strategies is crucial for successful trading. Without proper risk management, you may lose your capital. This section will guide you through essential techniques to protect your investments.
Setting Stop-loss
A stop-loss order helps you limit losses in a trade. It automatically sells your stock at a predetermined price. This prevents further losses if the market moves against you.
Here's how to set a stop-loss:
- Determine your risk tolerance.
- Set a price level where you will exit the trade.
- Place the stop-loss order with your broker.
For example, if you buy a stock at $100 and set a stop-loss at $90, your maximum loss is $10 per share. This strategy ensures you don’t lose more than you can afford.
Position Sizing
Position sizing is about deciding how much to invest in a single trade. Proper position sizing helps you minimize risk and maximize potential returns.
Follow these steps for effective position sizing:
- Determine your total capital.
- Decide the percentage of capital you are willing to risk per trade. A common rule is 1-2%.
- Calculate the dollar amount to risk by multiplying your total capital by the risk percentage.
- Divide the dollar amount to risk by the distance between your entry price and stop-loss price.
For instance, if your total capital is $10,000 and you risk 1%, you are risking $100 per trade. If the distance between the entry price and stop-loss is $2, you can buy 50 shares ($100 / $2).
Using these risk management strategies, you can trade confidently without losing your capital.
Real-world Examples
Learning to spot profitable chart patterns is vital for traders. Understanding real-world examples can help you make better trading decisions. Let's delve into two case studies: one successful and one unsuccessful.
Case Study: Successful Trade
In this example, we examine a successful trade using the Head and Shoulders pattern.
| Pattern | Entry Point | Exit Point | Profit |
|---|---|---|---|
| Head and Shoulders | $50 | $70 | $20 |
The Head and Shoulders pattern is a reliable indicator. It signals a reversal in the trend. The trader spots the pattern on the chart. They decide to enter the trade at $50. The stock price climbs to $70. The trader exits, locking in a $20 profit.
Case Study: Unsuccessful Trade
Now, we look at an unsuccessful trade involving the Double Top pattern.
| Pattern | Entry Point | Exit Point | Loss |
|---|---|---|---|
| Double Top | $60 | $50 | $10 |
The Double Top pattern can sometimes mislead traders. In this case, the trader identifies the Double Top. They enter the trade at $60. Unfortunately, the stock price drops to $50. The trader exits, incurring a $10 loss.
Real-world examples offer valuable lessons. They help traders identify patterns and make better decisions. By studying successful and unsuccessful trades, you can improve your trading strategies.

Credit: www.amazon.com
Common Mistakes To Avoid
Learning to spot profitable chart patterns is crucial for successful trading. Yet, many traders make common mistakes that can lead to significant losses. Knowing what to avoid is key to protecting your capital and making informed trades.
Overtrading
Overtrading is a common mistake among new traders. They often feel the need to make frequent trades to maximize profits. This behavior can drain your capital quickly. It’s crucial to be patient and wait for the right opportunities.
- Stick to your trading plan.
- Avoid making impulsive decisions.
- Set a limit on the number of trades per day.
Remember, quality over quantity. It’s better to make fewer, more informed trades.
Ignoring Market Context
Ignoring market context is another critical mistake. Many traders focus solely on chart patterns without considering the broader market conditions. The market context includes economic indicators, news events, and overall market trends.
| Chart Pattern | Market Context |
|---|---|
| Head and Shoulders | Check for economic news that could affect the pattern. |
| Double Top | Consider the overall market trend before trading. |
Always analyze the market context before making trades. This helps you make more accurate predictions and avoid losses.
Frequently Asked Questions
How Much Money Do Day Traders With $10,000 Accounts Make Per Day On Average?
Day traders with $10,000 accounts typically make $50 to $100 per day on average. Profits vary based on skill and market conditions.
Are Trading Chart Patterns Profitable?
Yes, trading chart patterns can be profitable. Traders must understand patterns and use them correctly. Success depends on analysis and strategy.
What Is The Best Way To Learn Chart Patterns?
Study reliable trading books, use online resources, and practice with demo accounts. Join trading communities for insights.
What Is The Most Successful Chart Pattern?
The most successful chart pattern is the Head and Shoulders. Traders often use it to predict market reversals.
Conclusion
Mastering profitable chart patterns is key to successful trading. Practice regularly to spot opportunities and minimize risks. Stay disciplined, use sound strategies, and protect your capital. Consistent learning and adaptation will enhance your trading skills. Start applying these tips today to see improvements in your trading performance.
Happy trading!